Most used charts showing key space radiation insights
- Matthew Gill
- Apr 16, 2024
- 1 min read

There are several charts and figures that have been put together to give key space radiation insights as well as answer common question, myths, and miss-conceptions. It doesn't cover all topics, just the ones that can be explained conveniently with charts :)
Over several weeks I shared these on LinkedIn and here they are, all in one place. Hopefully they are useful to a few people :)
They try to simply explain the following topics:
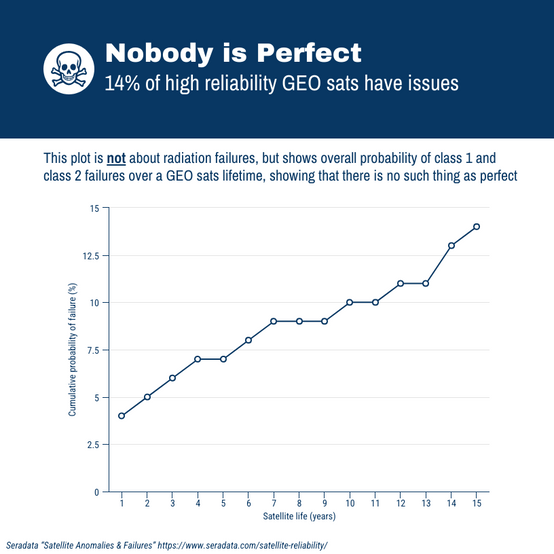
Even high reliability satellites will fail - Nobody is perfect
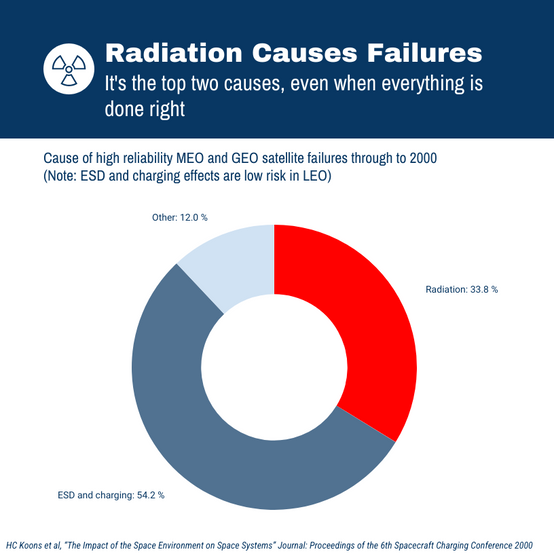
Radiation is a common cause of failures, even in high reliability satellites
Commercial Off The Shelf (COTS) electronics tend to struggle at Total Ionizing Doses (TID) over 25 kRad
Shielding has limitations on how much it can mitigate TID in sever orbits such as high LEO or MEO
High LEO (>1000 km) can be a worse environment then GEO for Single Event Effects (SEE)
Shielding can't stop destructive SEEs
Inclination has a big impact on SEE rates
De-rating power devices can mitigate destructive SEEs
Proton SEE testing has gaps
Please keep in mind that these aim to be very quick aids to help people understand key issues, and dispel some of the myths I keep hearing. They don’t encompass all of the nuance and corner cases associated with ensuring your hardware survives in space.


Comments